- Introduction
- In development of automotive on-board lithium ion batteries, safety design and evaluation must consider ignition and other problems caused by thermal runaway. Computer simulation technologies provide an understanding of battery safety-related phenomena and promote efficient design and evaluation, and Kobelco Research is engaged in research and development of simulation technologies capable of predicting lithium-ion battery safety. This paper discusses modeling techniques and analytical examples of safety test simulation, with examples drawn from modeling of heat measurement and reaction equations in chemical reactions, heat test simulation, and internal short circuit/nail penetration test simulation.
1. Modeling overview
Safety testing includes testing for heating, internal short circuit/nail penetration, overcharge, crushing, and other instances, but when evaluating thermal runaway conditions through thermal analysis, testing must consider three aspects of heating:
- ① External heating (oven, accelerating rate calorimeter (ARC), or other external heating)
- ② Internal heating (chemical reaction heat (e.g., thermal decomposition reaction, fuel) and Joule heating (short-circuit heating, discharge heating))
- ③ Heat radiation (heat transfer, thermal radiation)
If ③ is greater than ①+②, a thermal steady state is reached, but if heat radiation ③ is low, the temperature of a battery continues to rise, leading to thermal runaway.
The safety test simulation discussed in this paper considers three factors: External heating by an oven (heat testing), internal heating generated by short-circuits (internal short-circuit testing), and thermal decomposition reaction heat or other such chemical reaction heat and heat radiation.
2. Modeling of chemical reaction heat
-
- (1) Reaction phenomena modeled
-
The following four types of chemical reaction heat are considered. Anodic reactions entail multiple reaction processes and cannot be simulated by a single reaction formula. In general, these reactions are modeled in two parts, as a solid electrolyte interface (SEI) reaction and an anodic reaction.
- ① Thermal decomposition of separators
-
② Reaction between anode and electrolyte
- i) Reaction at SEI
- ii) Reaction of anode and electrolyte mediated by SEI (including direct reaction of anode and electrolyte)
- ③ Reaction between cathode and electrolyte
- ④ Thermal decomposition of electrolyte
-
- (2) Measurement of chemical reaction heat and modeling of reaction rate formula
-
The foregoing chemical reactions ① through ④ are modeled in each case by differential scanning calorimetry (DSC) performed at a steady rate of temperature increase, with use of the resulting transition in reaction heat. Specifically, in reactions ② and ③, the electrode active material in a charged state is collected by charging and disassembly, and this material and the electrolyte are used together for DSC performed in an inert environment.
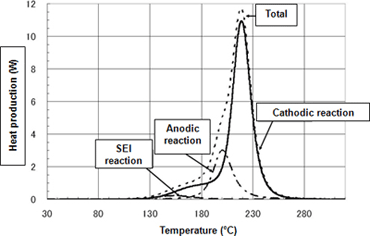
Figure 1 shows the transition in the rate of heat produced in various reactions as measured by DSC, with a temperature T-dependent heat production rate constant (amount of heat produced per unit volume•unit time) noted as k=k(T). The rate of heat produced (q) per unit volume in a given period is written as q(t)=k(T(t))αresidual(t). In the equation, αresidual(t) is the level of reaction incompleteness in the period. If the amount of heat produced is taken as proportional to the reaction rate, reaction completeness αreacted(t) up to a given point in time is written as αreacted(t)=Qreacted(t)/Qsum. Here, Qreacted(t) indicates the amount of heat generated up to such time, and Qsum indicates the total amount of heat generated. Reaction incompleteness is represented by αresidual(t)=1-αreacted(t). The heat production rate constant k is written as k(T)=Ak’(T). Here, A is the latent heat of reaction (amount of heat generated per unit mass), and k'(T) is a chemical reaction rate constant.
The latent heat of reaction A is determined from total heat generated and sample mass in each reaction, and the temperature T-dependent chemical reaction rate constant k’ is determined from the transition in heat generation rate by fitting to the following Arrhenius equation.
In the equation, γ represents a frequency factor, and E is activation energy. Omitting details, we see that this analysis employs a model1) accounting for changes in SEI as the reaction proceeds.
-
- (3) Example of active substance chemical reaction modeling
- Figure 1 presents DSC measurement in a 1-hour temperature increase process of (5° C/min) using a LiCoO2 cathode, carbon anode, and an electrolyte blend of EC (ethyl carbonate)/DEC (diethyl carbonate).
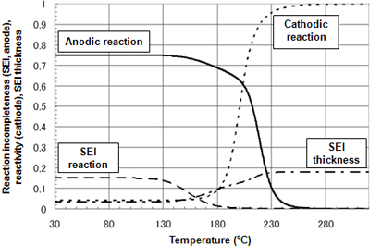
Figure 2 presents the transition in reactivity of each substance during the temperature increase process, as analyzed using chemical reaction rate formulae determined by peak fitting. In the anodic reaction, a reaction first develops at the SEI (375-475K), and a reaction then develops between the anode and electrolyte. The anodic reaction is rate-limited (425-475K) by SEI thickness, which increases as the reaction progresses, but with the subsequent transition to direct reaction with the electrolyte, the reaction rate increases substantially (475-525K).
-
In the equation, γ represents a frequency factor, and E is activation energy. Omitting details, we see that this analysis employs a model1) accounting for changes in SEI as the reaction proceeds.
- (3) Example of active substance chemical reaction modeling
- Figure 1 presents DSC measurement in a 1-hour temperature increase process of (5° C/min) using a LiCoO2 cathode, carbon anode, and an electrolyte blend of EC (ethyl carbonate)/DEC (diethyl carbonate).
-
Figure 1Measurement results for active substance reaction heat (DSC/temperature increase measurement)
-
Figure 2 presents the transition in reactivity of each substance during the temperature increase process, as analyzed using chemical reaction rate formulae determined by peak fitting. In the anodic reaction, a reaction first develops at the SEI (375-475K), and a reaction then develops between the anode and electrolyte. The anodic reaction is rate-limited (425-475K) by SEI thickness, which increases as the reaction progresses, but with the subsequent transition to direct reaction with the electrolyte, the reaction rate increases substantially (475-525K).
-
Figure 2Chemical reaction rate-based formula analysis of reactivity in temperature increase process (5°C/min)
3. Safety test simulation
Here we present an example of simulation using the chemical reaction rate formula determined in Section 2. The battery analyzed was an 18650-size cylindrical battery with a LiCoO2 cathode, carbon anode, and an EC/DEC electrolyte. Table 1 presents the analysis parameters.
-
-
- (1) Thermophysical properties
- Means for property values of density, specific heat, and heat transfer coefficient within electrode surfaces were determined by measurement of individual cathodic electrode sheets, anodic electrode sheets, and separators. The thermal diffusivity of film stacks was measured in an orientation perpendicular to the electrode surfaces.
-
- (2) Radiant thermophysical properties
- Thermal radiation from battery surfaces is expressed as the sum of heat transfer (proportional to difference between surface and ambient temperatures) and heat radiation (proportional to difference of the fourth powers of ambient temperature and surface temperature). Heat transfer is a coefficient dependent on the ambient state (composition/flow rate); whereas, heat radiation depends on the surface material. Heat transfer coefficients and heat radiation coefficients are determined by fitting of surface temperature changes derived from oven experiments under numerous conditions.
-
- (3) Analysis
- The analysis solves for chemical reactions/reaction heat accompanying temperature increase from external heating (heat testing) or Joule heating (internal short-circuit testing). The analysis also solves for the temperature distribution of the battery resulting from heat transfer and heat radiation. The CAE software used is COMSOL MultiphysicsTM V3.5a by COMSOL.
-
- (4) Heat test simulation
- Figure 3 presents results for heat test simulation. The heating regime was ambient temperature raised to a target temperature and then maintained. At a target temperature of 145° C, self-heating is observed but does not lead to thermal runaway, and a steady state is reached. However, at a target temperature of 155° C, thermal runaway is reached in an interval of approximately 2000 seconds, and surface temperature rises precipitously. At a target temperature of 153° C, surface temperature rises precipitously in an interval of approximately 2400 seconds, but a steady state is then achieved. Progression of the chemical reaction increases surface temperature precipitously to approximately 100° C or more and is regarded, practically, as equivalent to thermal runaway.
-
-
Table 1List of analysis parameters (18650-size cylindrical battery)
Form (18650-size cylindrical battery) Length 65 (mm), radius 9 (mm) Cathode active substance quantity 12 (g) Anode active substance quantity 6 (g) Thermal conductivity (cylinder axial orientation (parallel to electrode surfaces)) 14 (W/m K) Thermal conductivity (radial orientation (perpendicular to electrode surfaces)) 3.4 (W/m K) Specific heat (battery average) 830 (J/kg K) Density (battery average) 2580 (kg/m3) Heat transfer coefficient Determined by heat radiation testing Thermal emissivity Determined by heat radiation testing Figure 3Transition in battery surface temperature during heat test simulation
(Target temperatures 145°C, 153°C, 155°C)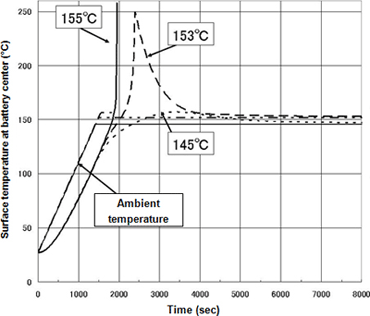
-
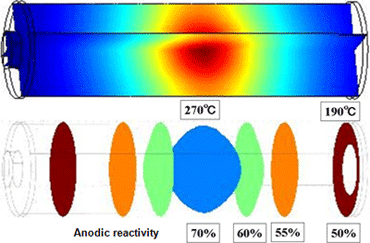
Figure 4 presents the internal temperature distribution and anodic reactivity distribution in the time frame to reach thermal runaway at a target temperature of 155°C. The central portion of the battery represents the highest temperature and forms the origin of thermal runaway. This phenomenon is attributed to thermal storage. The temperature difference between the ends and center of the battery reaches 80°C.
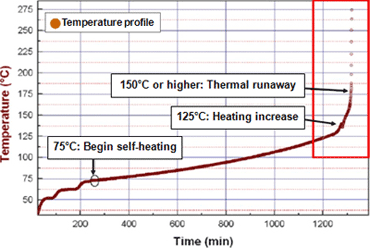
Figure 5 presents accelerating rate calorimeter (ARC) test results for the same battery type. The results show self-heating starting at 73°C, an increase in heating starting at 125°C, and thermal runaway beyond 150°C. These results show that the temperature of thermal runaway predicted by simulation is valid. -
Figure 4Internal temperature (190-270°C) (upper) and isosurfaces for anodic reactivity (lower) at inception of thermal runaway, at target temperature of 155°C
-
-
- (4) Internal short-circuit (nail penetration) test simulation
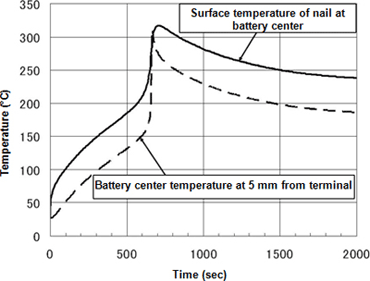
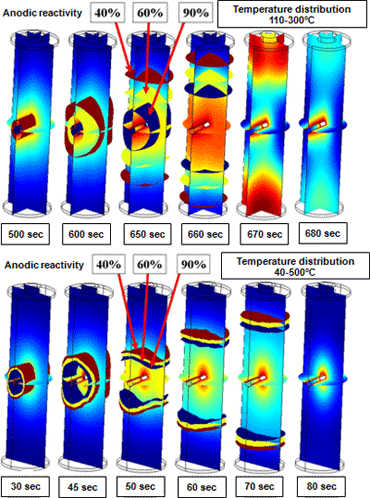
- The figures below present results for internal short-circuit test simulation of a 2.5 mm thick nail passed through the center of a battery. These simulations analyzed instances of 20W and 100W short-circuit heating Figure 6 presents the temperature profile of two points on the cylindrical axis in 20 W short-circuit heating. A precipitous increase in temperature due to thermal runaway is observed in the time frame of 600-700 seconds. Figure 7 presents the temperature distribution and anodic reaction surface during thermal runaway. Over several 10-second periods, a broad reaction area migrates from the vicinity of the nail toward the battery terminals. It is apparent that temperatures are high in the reaction area. In contrast, at the rapid heating rate in 100W short-circuit heating, thermal runaway develops in the interval of 30-70 seconds. The resulting large internal temperature gradient and narrow reaction area give the reaction surface formed the appearance of migrating from the vicinity of the nail toward the battery terminals.
-
-
Figure 5Accelerating rate calorimeter (ARC) test results for battery type studied in simulation
-
-
Figure 6Temperature change in 20 W short-circuit heating at nail surface at battery center (solid line) and at location 5 mm from terminal (broken line)
-
-
Figure 7Transition in isosurfaces for temperature distribution (color contours) and anodic reactivity during thermal runaway in 20 W (upper) and 100 W (lower) short-circuit heating
- Conclusion
- This paper provides examples of lithium-ion battery safety test simulations in the form of chemical reaction modeling, heat test simulation, and internal short-circuit/nail penetration test simulation. Though the specific examples presented concern an 18650-size cylindrical battery, similar technologies form the basis for ongoing research and development of safety test simulation technologies for automotive on-board lithium ion batteries.
In addition to the macro-scale safety test simulation described in this paper, Kobelco Research offers modeling and simulation on multiple levels, including charge/discharge test simulation, electrode-internal ion transport simulation, and nano-simulation of electrode surface reactions. From materials design and selection to battery design and evaluation, the company utilizes a broad array of simulation technologies in conjunction with verification testing and measurement/analysis testing.
- References
-
- 1) J.R.Dahn et. al: J. Electrichem. Soc. 148 (2001) A663, A755.
Examination & research example
- Automotive
- Automotive Durability Evaluation Technology ~ 4-Poster Testing~
- Automotive Durability Evaluation Technology ~Durability Test and Measurement Technology ~
- Evaluation Technologies on High Strength Steel Sheet Atmospherefor Automobiles
- Safety Evaluation Test of On-board Lithium-ion Battery
- Techniques for Evaluation of Applicability of Biofuels


